STEP 6: Graphing Data
|
Tip #4 Continued: Use a pattern of numbers for each axis on your graph |

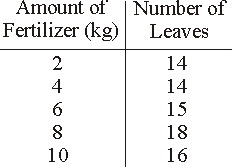
A good pattern for the manipulated variable would be (2, 4, 6, 8, 10). The numbers are already arranged by twos, so this part is easy. A good pattern for the responding variable might be (12, 14, 16, 18, 20). This pattern covers the smallest number on the RV side (14) and the largest number (18).
 |
 |