|
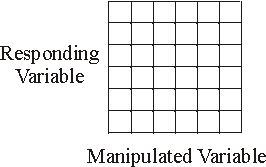
Tip #2: Put your MV on the x axis and RV on the y axis |
The horizontal axis (or x axis) on a graph shows the manipulated variable. Therefore, you must write your MV just below the x axis on your graph. The vertical axis (or y axis) represents the responding variable in your experiment. Write your RV to the left of the y axis on the graph. Look at the graph below to see how to label each axis.

 |
 |